

Items of Interest
- Economic Overview
- Rate Cuts are Here (Did the Fed Get it Right?)
- Inflation Breakdown
- The Dual Mandate (The Impossible Formula)
- Permanent Income Hypothesis on Display
- Wrapping Up Election Season
- Economic Plans
- The Markets Going Forward
Market Overview
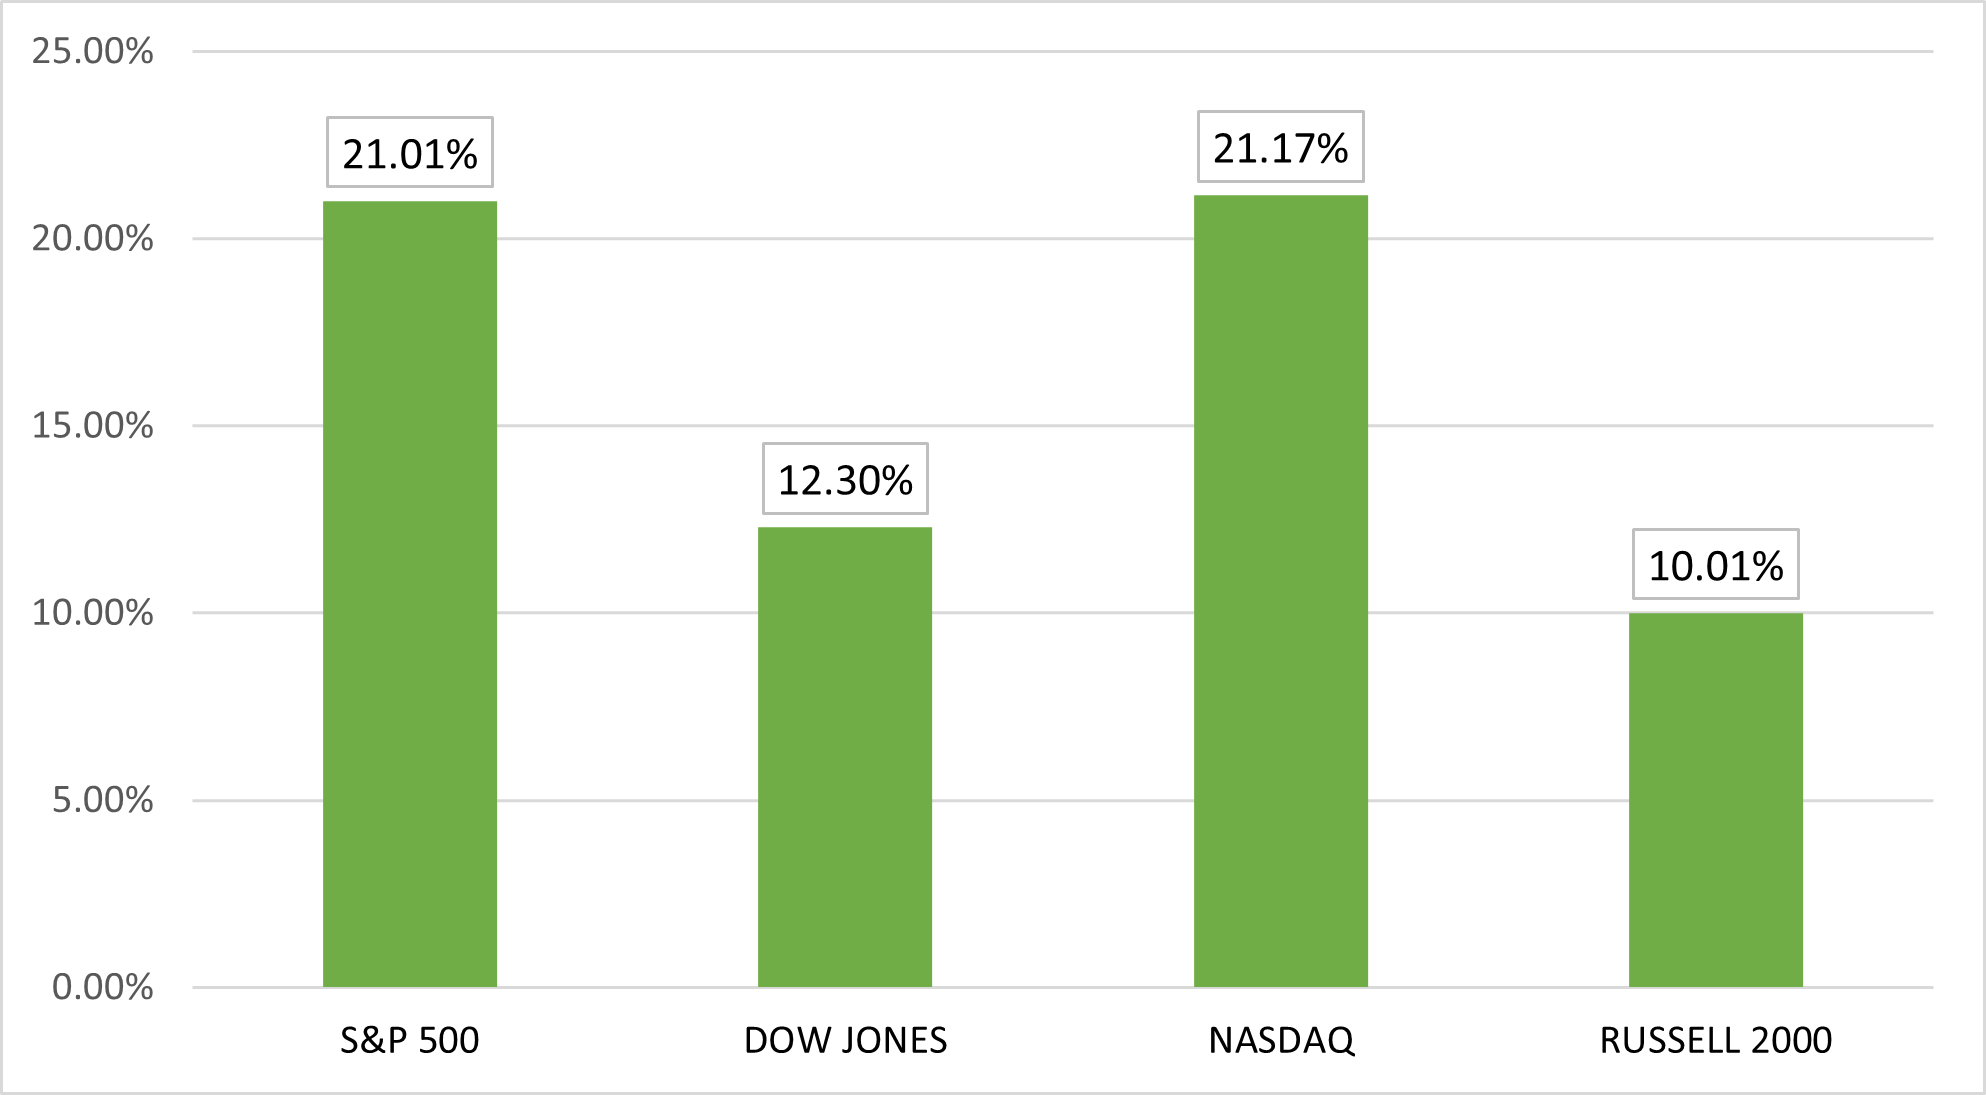
The third quarter of 2024 ended up, with all four market indices advancing. The Russell 2000 finally broke out of its multiyear trading range and ended up performing the best in Q3, up +8.17%. The S&P 500 ended up +5.24% for Q3. Out of the twelve market sectors, ten ended up. Utilities were by far the best-performing sector (+19.42%) while Information Technology performed the worst (-1.25%).[1] The market indexes (Dow Jones, S&P 500, NASDAQ, & Russell 2000) ended as follows year to date:[2]
Economic Overview
The Q2 weakness in the markets was replaced by a relatively strong rally in Q3. This is partially due to the fact that the historically volatile September actually ended up for a change due to the Federal Reserve 50 basis point (0.5%) rate cut that had been highly anticipated.
The US is still by far the strongest economy in the world this year, and its lead is growing. However, the spending machine that keeps the US economy growing has continued to show a slowing down. Positive forces in the economy still prevail, but the gradual deceleration from Q1 & Q2 continues. The market broadening that we saw in Q1and subsided in Q2 came back with a rigor in Q3. So much so, that the Russell 2000 outperformed the rest of the market indexes. Unemployment has ticked up slightly but remains in a healthy range. This is partly due to the chronic and continuing lack of population to keep competition in the US workforce. Overall, the economy is still in good shape, but there are some issues.
Here is the January through September economic synopsis:
- GDP is forecasted to decelerate from Q2 growth of 3.0% to 2.8% for Q3.[1] These numbers are annualized of course. Both these numbers are still better than Q1.
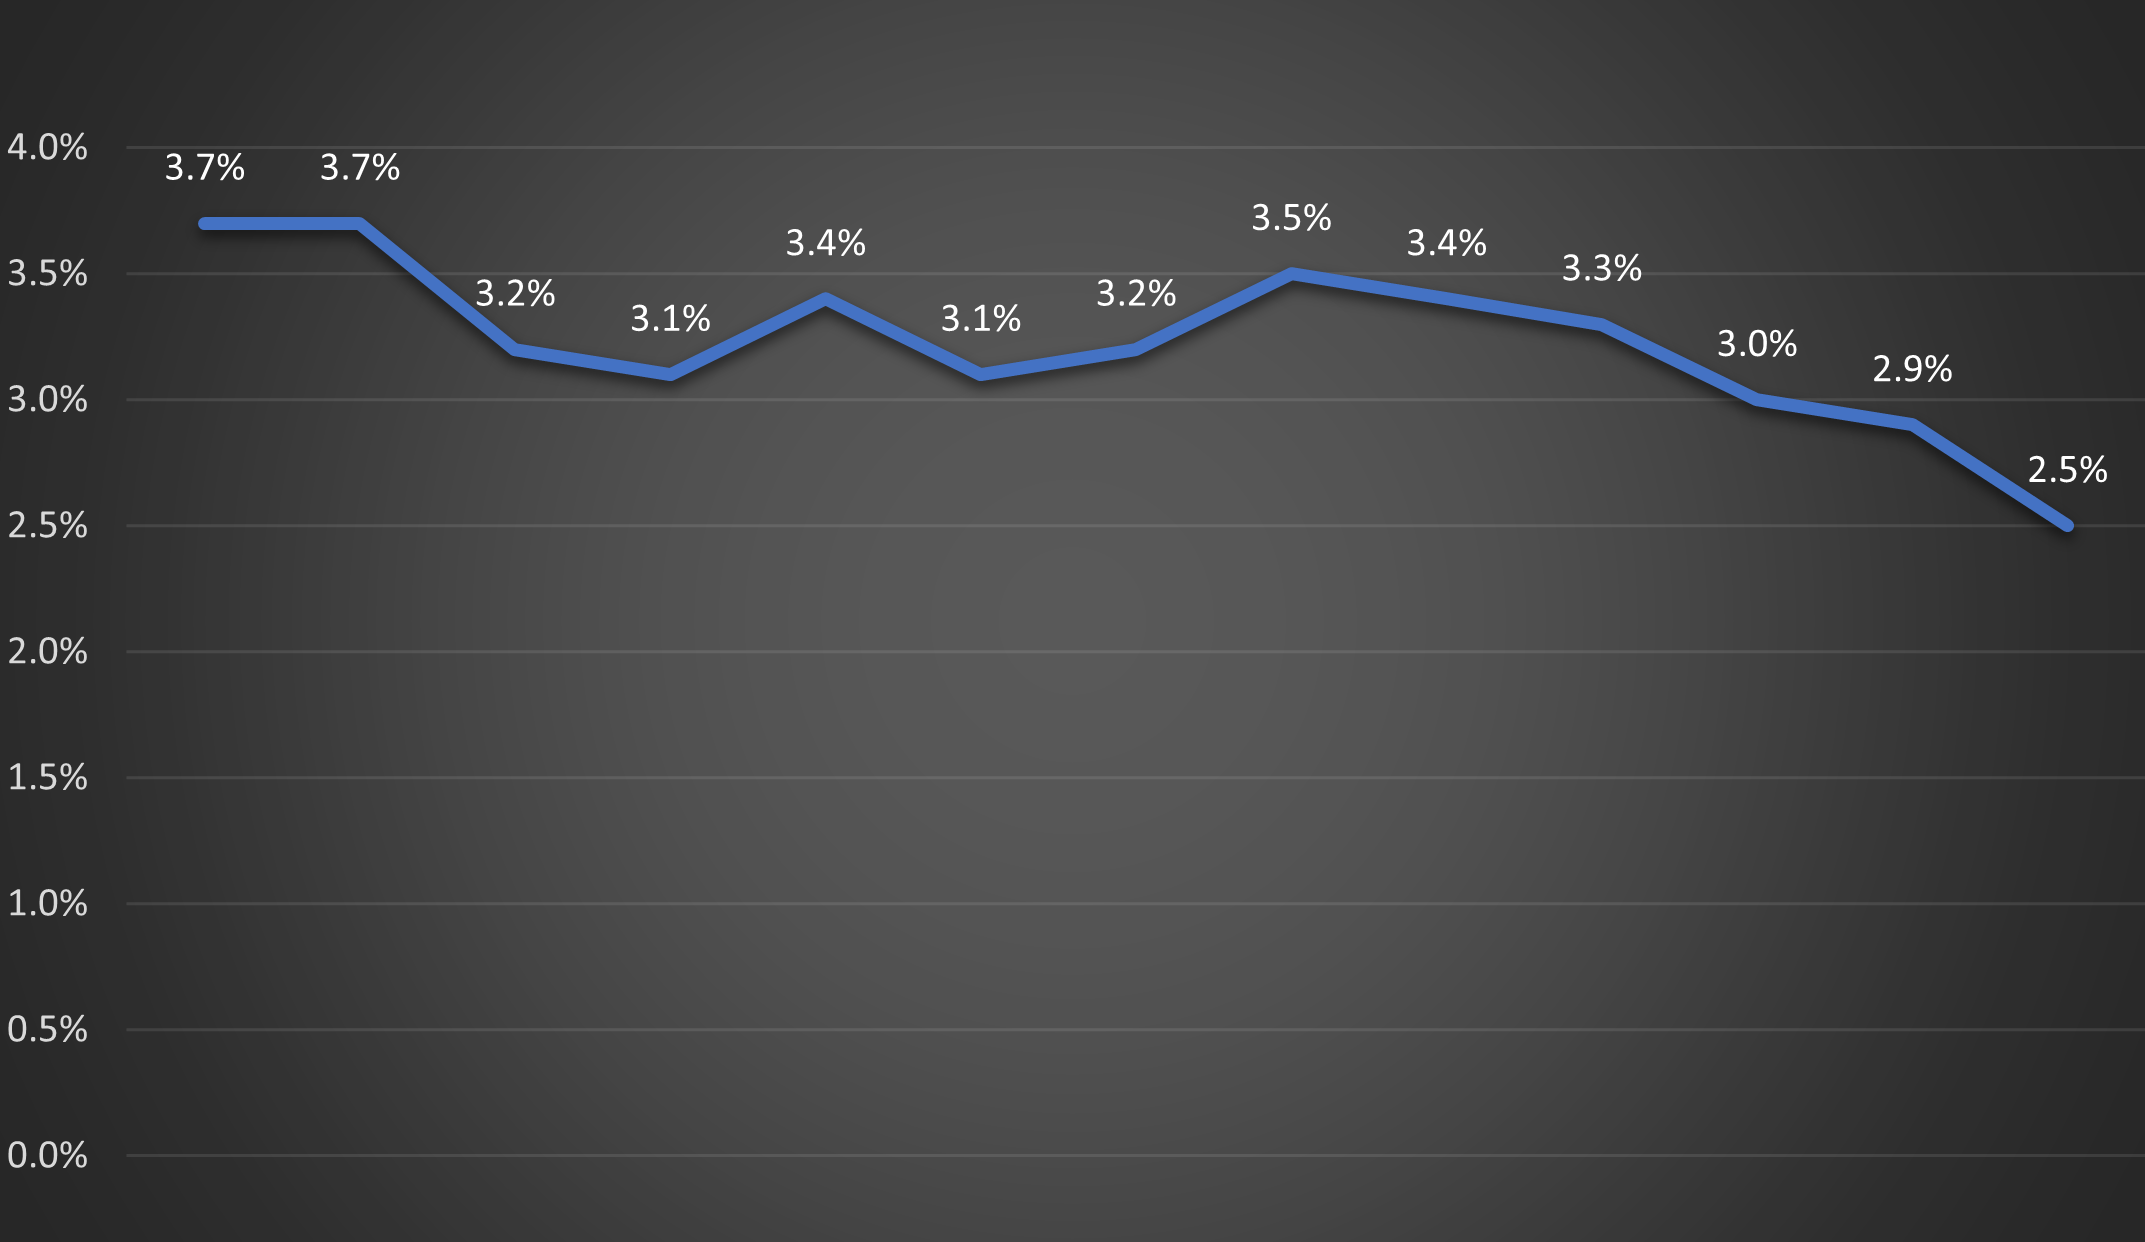
- Inflation, as of August 31st, stood at 2.9% year over year.[2]
- The Industrial Production Index increased from 101.483 in January to 103.1389 in August.[3]
- The Unemployment Rate saw a slight uptick to 4.1% as of September.[4]
- 1,729,000 full time equivalent jobs were created from January – September 2024.[5]
So, distilled down, this data is still positive, but not as good as Q2. Inflation is down slightly, unemployment is up slightly, and production is up.
Rate Cuts are Here (Did the Fed Get it Right?)
The Federal Reserve cut rates. It happened. The approximately 4 year time period of either raising rates or holding still came to an end in August when the Fed delivered a .5% (50 basis point) rate cut. This lowered the rates to 4.75 – 5.0%. The market traders betting on the rate cut were right for once. This means that the likelihood of 2 rate cuts for 2024 is extremely high now. Those that believe that inflation is not completely dealt with are frankly not happy with the cut, but if short term growth in the equity market and mortgage rate reduction are the most important factors, then you would agree with the cut.
There have been many commentaries and opinions on this cut, so I will not opine and simply distill down what this cut means. The Fed cuts rates for 2 reasons under their mandate from Congress: either The Fed sees the economy is slowing or unemployment is rising. So, while the markets cheer this move toward less expensive debt, why are we cheering for a move that means there is an issue? Maybe the issue is not major or pervasive, but there is an issue nun the less. However, Fed Chair Powell did announce that quantitative tightening is continuing, so the effects of the cut will not be as dramatic as they could have been. The Fed is both cutting rates and tightening by reducing their balance sheet, so at the very least, The Fed is hedging at this point. We will see if the decision is right in the long run. If The Fed is forced to raise rates later, remember this moment and that it could have been avoided with a little more patience.
Inflation Breakdown
Inflation has now printed its first 2.5% annualized rate since posting 2.6% in March of 2021. Leaving the 3% range is a huge milestone, but energy prices and a potentially disastrous dock worker strike, that is still not completely over as of the writing of this update, could cause this stint into the 2% range to be short lived. Despite the lower number in August, inflation continues to remain at long term averages. Hopefully the Longshoreman strike will be settled shortly and the cut will not be counterproductive. Here is the chart of inflation over the last 12 months:
The Dual Mandate (The Impossible Formula)
Before moving on from the Federal Reserve, it would behoove us to spend a moment seeing exactly what The Federal Reserve’s role is in the economy and why it has been so important over the last few years. The Federal Reserve was established in December 1913 in response to a series of financial panics, particularly the Panic of 1907, which highlighted the need for a central banking system to provide stability to the U.S. financial system by regulating the nation’s money supply, supervise banks, and act as a lender of last resort during financial crises.
In 1977 Congress added an interesting task to the Fed’s responsibilities called The Dual Mandate. This mandate directs the central bank to pursue two primary objectives: maximum employment and stable prices. The goal of maximum employment encourages the Fed to promote a robust labor market where most people who want to work can find jobs. Meanwhile, stable prices refer to maintaining low and predictable inflation, ensuring that the purchasing power of money is preserved over time. The part of this that makes it an impossible problem to solve is that stimulating employment through lower interest rates may risk inflation, while combating inflation with higher rates might slow job growth. So, when seeing the Fed switch back and forth from focusing on inflation to unemployment, it is not a random shift. The Fed is simply trying to balance both: an impossible task.
The Permanent Income Hypothesis on Display
Looking back over the last 3-4 year period, the same things have been said quarter after quarter: people are not decreasing their spending commensurate with the increase in prices. Debt has gone up, and households have only increased spending over the last few years. Instead of simply wondering at how this could be, it may be time to break out an old economic theory: Milton Friedman’s Permanent Income Hypothesis (PIH). This theory, that Friedman introduced in 1957, speculates that an individual’s consumption patterns are driven not by their current income but by their “permanent income,” which is the average level of income they expect to maintain over time. According to Friedman, consumers distinguish between transitory income, which includes short-term fluctuations, and permanent income, which reflects their long-term expectations. Rather than adjusting consumption to match short-term increases or decreases in income, individuals base their spending on their perception of their stable, lifetime income. As a result, short-term changes in income, such as bonuses, pay cuts, or even stimulus checks are less likely to influence consumption decisions significantly.
By emphasizing the long-term expectations of consumers, the PIH helped economists better understand why individuals might smooth their consumption over time, rather than immediately altering their spending in response to short-term income fluctuations. I believe the U.S. economy from 2020 till now has illustrated this hypothesis.
This period showed an interesting pattern where people didn’t cut their spending as much as you might expect, even with rising prices and economic challenges. People seem to base their spending not just on what they’re earning right now but on what they expect to earn over the long term. So, instead of reacting to short-term issues like inflation or temporary income boosts, people tend to keep their spending steady. It seems that only disaster is important enough to cause a spending change.
During the last four years, even though inflation made things more expensive, many Americans kept spending at the same or higher levels. Instead of cutting back, they used savings or took on more credit to maintain their lifestyle. This suggests that people believed that the economic problems would eventually pass, and their long-term income would stay stable. According to Friedman’s hypothesis, this explains why people didn’t drastically change their spending habits, even with signs of economic trouble like rising prices and talks of a possible recession.
This explains the recent lack of consumer pivoting. However, while Friedman’s theory explains why people may not immediately react to economic shocks, the longer-term effects of high inflation and economic uncertainty may eventually force a shift in spending behavior. We should keep an eye on the situation over time and see if Friedman’s hypothesis comes into play over the long-term.
Wrapping Up Election Season
Regardless of which side of the isle people subscribe to, most of us are beginning to see the proverbial light at the end of the tunnel and are close to finally breathing a sigh of relief. But, this year has not only been chaotic for the United States. Over 60 countries have held or will hold elections this year. Some of the notable ones include: The United States, India, Great Britain, Mexico, South Africa, France, and many others.
These elections have results in a mix of different outcomes. Some countries have pivoted to the right while others have gone to the left. Some countries in the European Union have even gone more to the right in their EU elections and gone more to the left in their domestic ones. Everywhere in the world is illustrating the closeness in the divide between the right and the left. This is not simply an American phenomena, it is a human one.
With one month left until the US elections, the Presidential race is one of the closest ever seen in modern American history. Depending on the week, President Trump and Vice President Harris trade 0-2% leads nationally and in the 6-8 key swing states. No one knows who will win, but we will most likely end up with divided government with the Senate and the House of Representatives most likely ending up being controlled by opposite parties. This would not be a bad thing for the markets since gridlock brings certainty around preexisting policies. We will see what happens, but election season is almost over.
Economic Plans
Regardless of which side of the isle people
Before we leave the 2024 election topic for the last time, let us take a moment to look at both Trump and Kamala’s economic plans from a nonpolitical, strictly economic view. Here is a summary of the major economic issues, and a simplistic comparison of both candidates plans for those issues:
| Kamala Harris’s Plan | |
| General Approach | Expands Biden’s policies; focuses on lowering costs and expanding social safety nets. |
| Housing | Construct 3 million new homes and offer $25,000 for first time home buyers. |
| Healthcare | Expand insulin cost cap to all patients. Other aspects of the plan are still unknown. |
| Inflation Control | Crack down on corporate pricing. Other aspects unknown. |
| Tax Policy | Tax incentives for housing construction/small business, expand the child tax credit, |
| Trade Policy | tax unrealized gains.
No specific new trade policies announced. |
| Corporate Regulation | Aggressively regulate corporations. |
Kamala’s plan is more in line with the Carter era policies of the 1970s. The only significant policy that hasn’t been tried before is the taxing of unrealized gains. The effects are unknown but are suspected to cause mass issues in the public stock market and even private company ownership. Mainly, the policies are a continuation of the Biden era.
| Donald Trump’s Plan | |
| General Approach | Focuses on tax cuts, deregulation, and protectionist trade policies. |
| Housing | No specific policies announced expect for an abstract attempt to influence the Fed to further lower rates. |
| Healthcare | No specific policies announced. |
| Inflation Control | Cut taxes to stimulate the economy and reduce costs; minimal regulatory intervention. |
| Tax Policy | Large-scale tax cuts, including a focus on reducing corporate taxes to 15-21%. |
| Trade Policy | Proposes new tariffs, including a minimum 20% tariff on all imports to boost American manufacturing. |
| Corporate Regulation | Reduce regulations to encourage business investment. |
President Trump’s plan is in keeping with his prior term with the exception of tariffs. The 20% across the board tariffs will most likely be highly inflationary and is the worst part of his proposals thus far. As far as the markets go, his tax policies should increase investment in both public and private companies.
Both plans, in reality have major flaws are not what was hopped for by economists generally. Both plans are inflationary, and both are pro government intrusion into economic affairs. Also, their plans most likely will increase the Federal deficit by 2-4 trillion over the next 10 years. In summary, both as flawed. So, don’t count on either candidates’ plan saving personal finances. That work has to be done at home.
The Markets Going Forward
With all of the factors mentioned above, the next question, as always, is: what does this look like for the markets going forward? Looking at all the elements above plus the continued Israel-Hamas conflict, the war in Ukraine, political turmoil surrounding the 2024 elections, and the Longshoreman strike, opportunity is still the best word to describe where we are. Q1, was great, Q2 was ok, Q3 was good, but Q4 is still an unknown gift to be unwrapped. Still, despite all the issues, the economy is still in good shape overall.
All these items considered, here are the factors to watch for this year:
- Continued War in Ukraine & Escalating War in Israel
- Energy Prices Rising
- Inflation in the 2%-4% Range
- The Federal Reserve Beginning a Rate Cut Cycle
- The Presidential Election Cycle Ending
- The Battle Between Unions and Artificial Intelligence
All of these factors still paint a picture of both issues and big opportunities. Once again, no one knows what the future holds. However, the theme of uncertainty from 2023 has remained through to 2024, but the uncertainty should be looked at through the lens of optimism. Remember that no matter what year it is or who is running for President, uncertainty remains most of the time, but the number of negatives has decreased since Q2. Discipline is still the name of the game. Our moto moving forward should still be: steadfast and unmovable.
[2] https://www.marketwatch.com/market-data
[3] https://fred.stlouisfed.org/
[4] https://fred.stlouisfed.org/
[5] https://fred.stlouisfed.org/
[6] https://fred.stlouisfed.org/
[7] https://data.bls.gov/timeseries/CES0000000001&output_view=net_1mth
Article written by Jonathan Chamberlain of Chamberlain Financial Services an Investment Advisor Representative, holding a Series 7 and Series 66 securities license.
Securities and advisory services offered through Sunbelt Securities, Inc. Member FINRA/SIPC. CPA and related accounting services offered through Chamberlain Financial Services are not associated with the services of Sunbelt Securities, Chamberlain Financial Services and Sunbelt Securities, Inc. are unaffiliated companies. Sunbelt Securities, Inc. does not provide tax or legal advice. Tax advice and preparation services are strictly offered by Neil Chamberlain, CPA.